关于创建图表
您可以使用四种不同的语法在 Markdown 中创建图表:mermaid、geoJSON、topoJSON 和 ASCII STL。GitHub Issue、GitHub Discussions、Pull Request、Wiki 和 Markdown 文件中都支持图表渲染。
创建 Mermaid 图表
Mermaid 是一款受 Markdown 启发的工具,可将文本渲染成图表。例如,Mermaid 可以渲染流程图、序列图、饼图等等。有关更多信息,请参阅Mermaid 文档。
要创建 Mermaid 图表,请在带有 `mermaid` 语言标识符的围栏代码块内添加 Mermaid 语法。有关创建代码块的更多信息,请参阅“创建和突出显示代码块”。
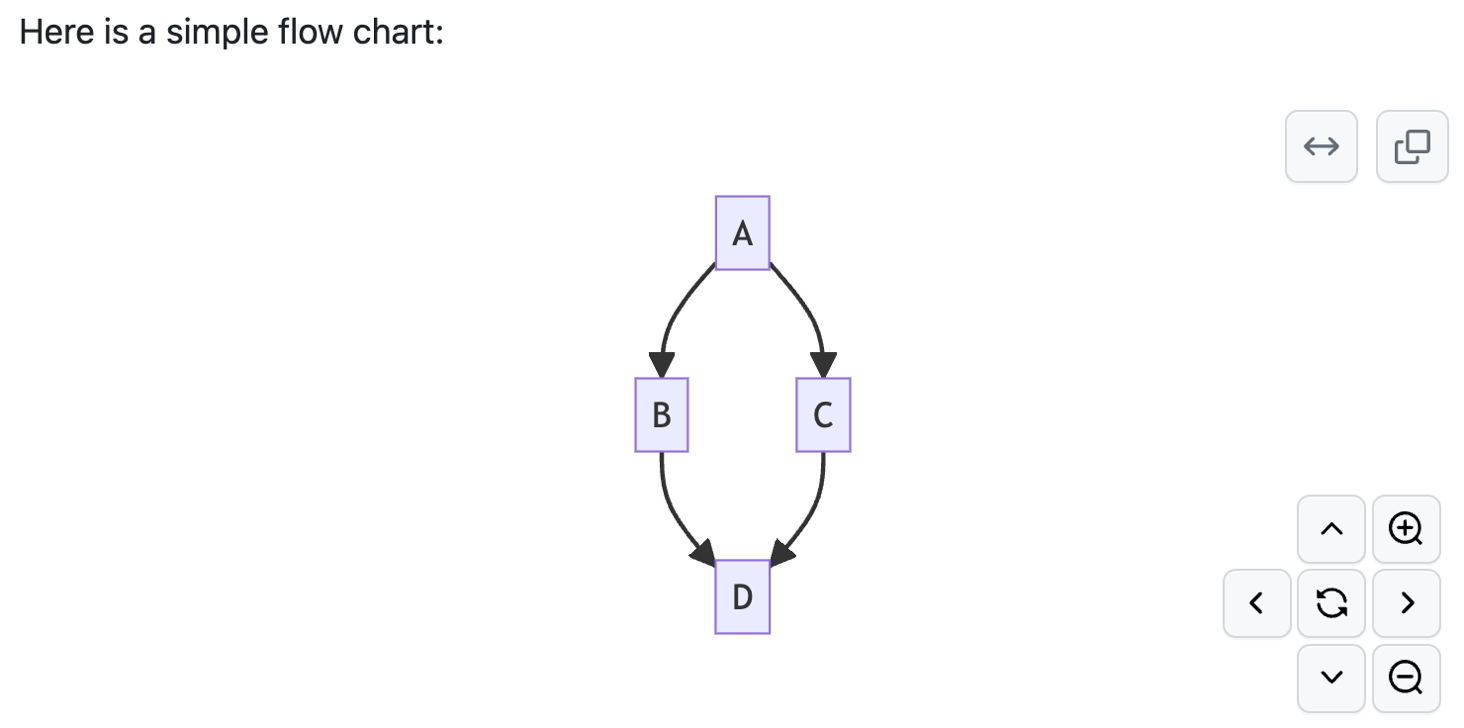
例如,您可以通过指定值和箭头来创建流程图。
Here is a simple flow chart:

```mermaid
graph TD;
    A-->B;
    A-->C;
    B-->D;
    C-->D;
```

注意
如果您在 GitHub 上使用 Mermaid 语法时运行第三方 Mermaid 插件,可能会出现错误。
检查您的 Mermaid 版本
为确保 GitHub 支持您的 Mermaid 语法,请检查当前使用的 Mermaid 版本。
```mermaid
  info
```
创建 GeoJSON 和 TopoJSON 地图
您可以使用 GeoJSON 或 TopoJSON 语法创建交互式地图。要创建地图,请在带有geojson或topojson语法标识符的围栏代码块内添加 GeoJSON 或 TopoJSON。更多信息,请参见“创建和突出显示代码块”。
使用 GeoJSON
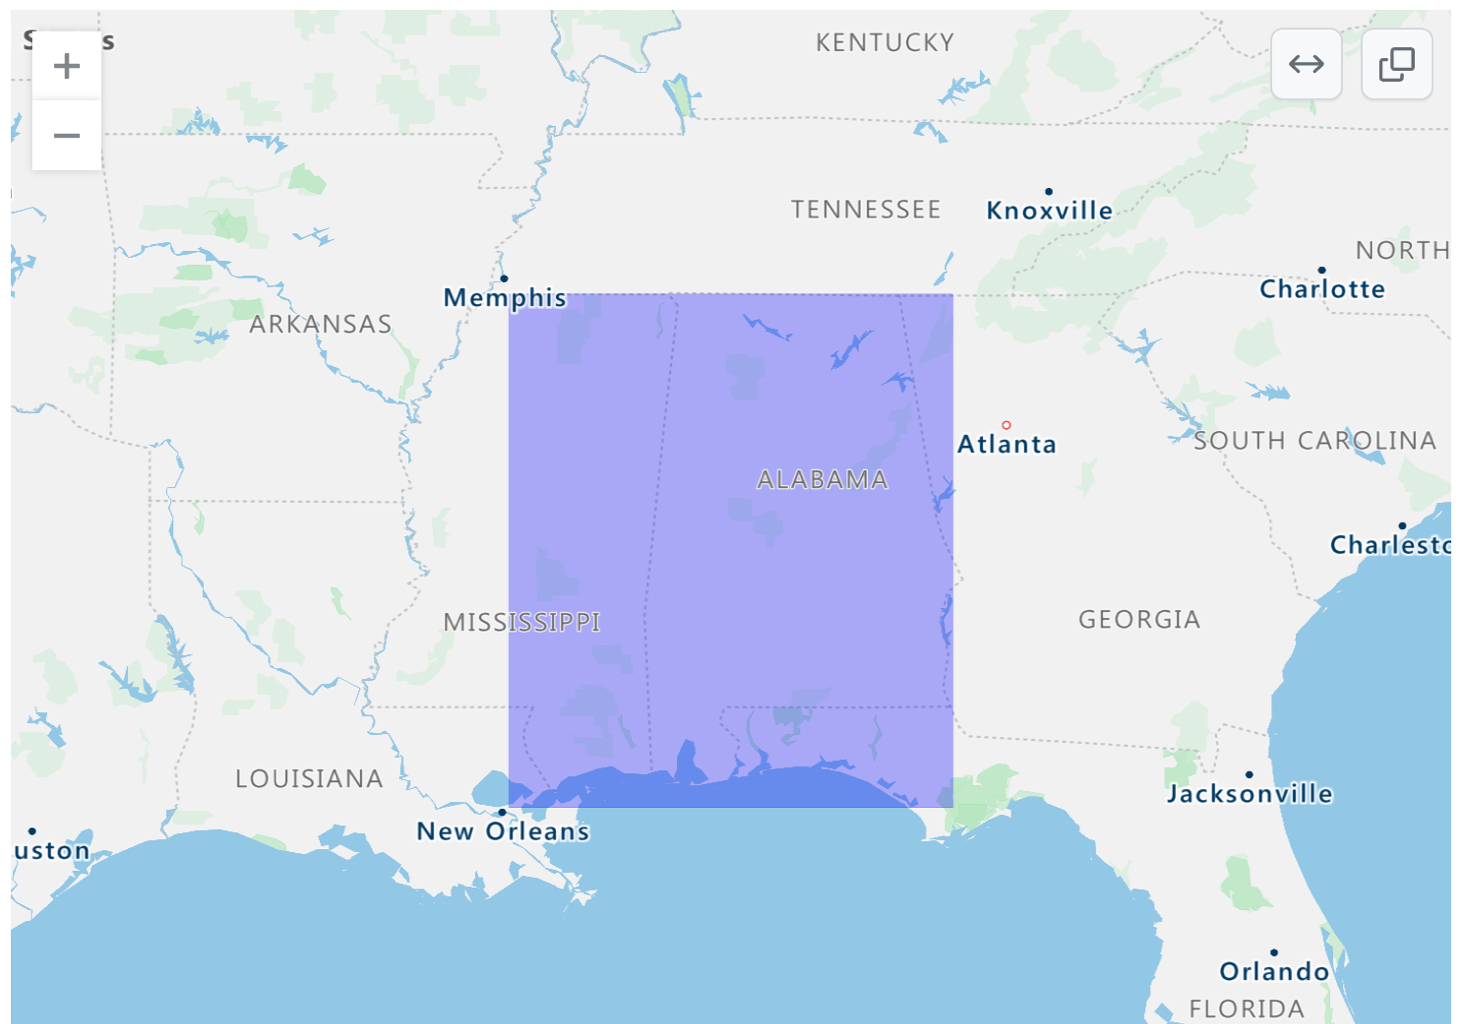
例如,您可以通过指定坐标来创建地图。
```geojson
{
  "type": "FeatureCollection",
  "features": [
    {
      "type": "Feature",
      "id": 1,
      "properties": {
        "ID": 0
      },
      "geometry": {
        "type": "Polygon",
        "coordinates": [
          [
              [-90,35],
              [-90,30],
              [-85,30],
              [-85,35],
              [-90,35]
          ]
        ]
      }
    }
  ]
}
```

使用 TopoJSON
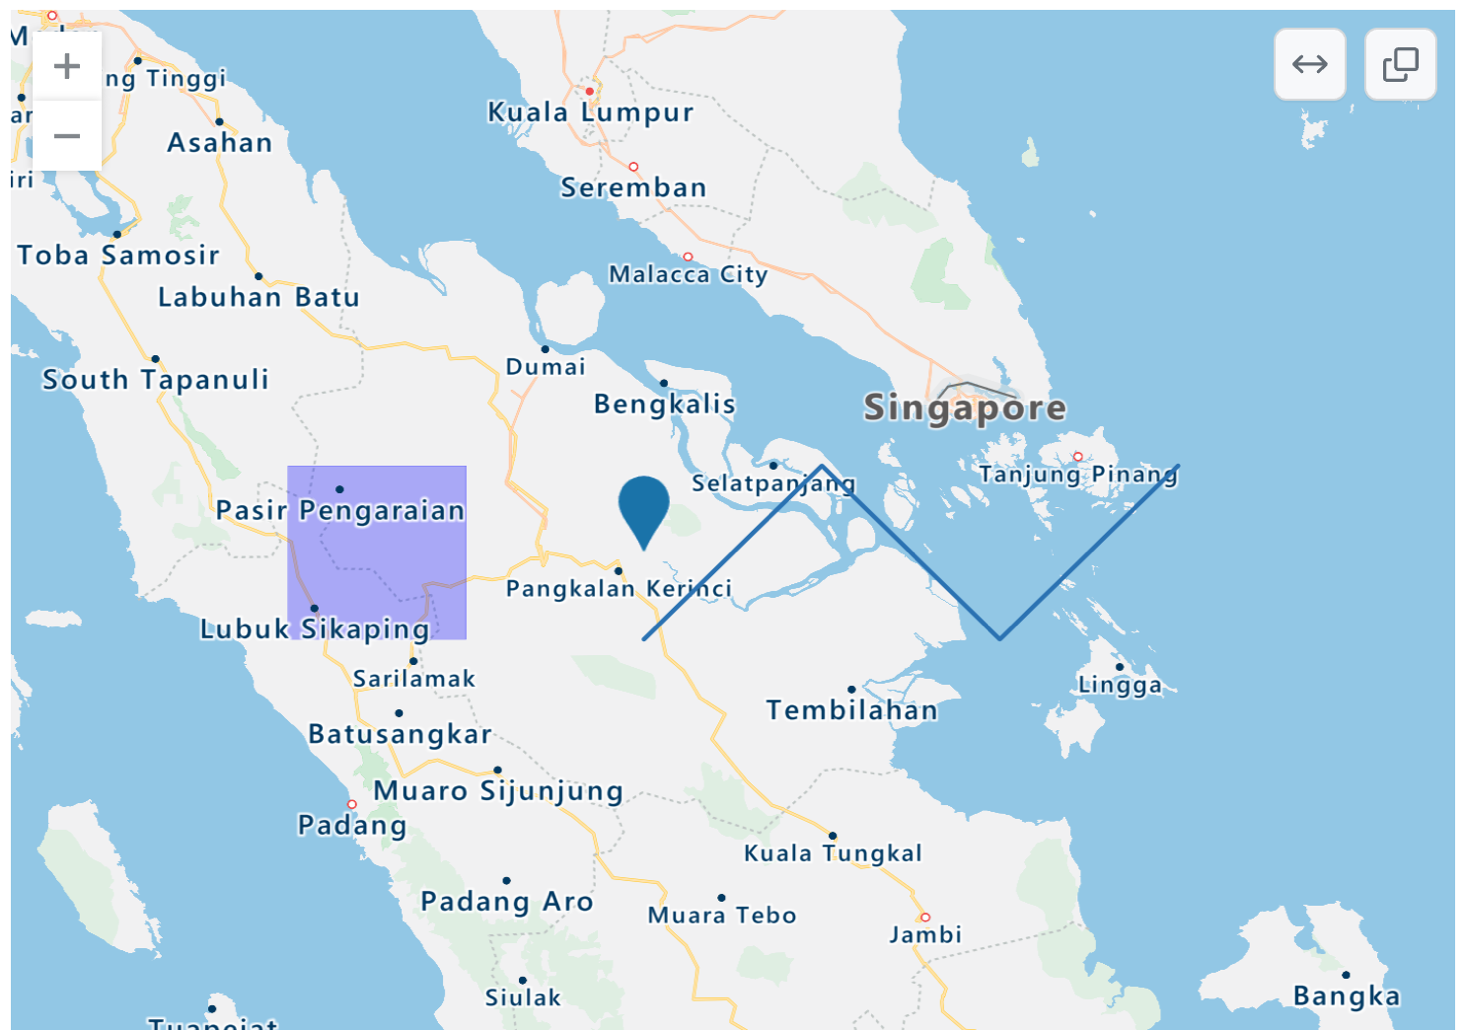
例如,您可以通过指定坐标和形状来创建 TopoJSON 地图。
```topojson
{
  "type": "Topology",
  "transform": {
    "scale": [0.0005000500050005, 0.00010001000100010001],
    "translate": [100, 0]
  },
  "objects": {
    "example": {
      "type": "GeometryCollection",
      "geometries": [
        {
          "type": "Point",
          "properties": {"prop0": "value0"},
          "coordinates": [4000, 5000]
        },
        {
          "type": "LineString",
          "properties": {"prop0": "value0", "prop1": 0},
          "arcs": [0]
        },
        {
          "type": "Polygon",
          "properties": {"prop0": "value0",
            "prop1": {"this": "that"}
          },
          "arcs": [[1]]
        }
      ]
    }
  },
  "arcs": [[[4000, 0], [1999, 9999], [2000, -9999], [2000, 9999]],[[0, 0], [0, 9999], [2000, 0], [0, -9999], [-2000, 0]]]
}
```

有关使用.geojson和.topojson文件的更多信息,请参见“使用非代码文件”。
创建 STL 3D 模型
您可以直接在 Markdown 中使用 ASCII STL 语法来创建交互式 3D 模型。要显示模型,请在带有stl语法标识符的围栏代码块内添加 ASCII STL 语法。更多信息,请参见“创建和突出显示代码块”。
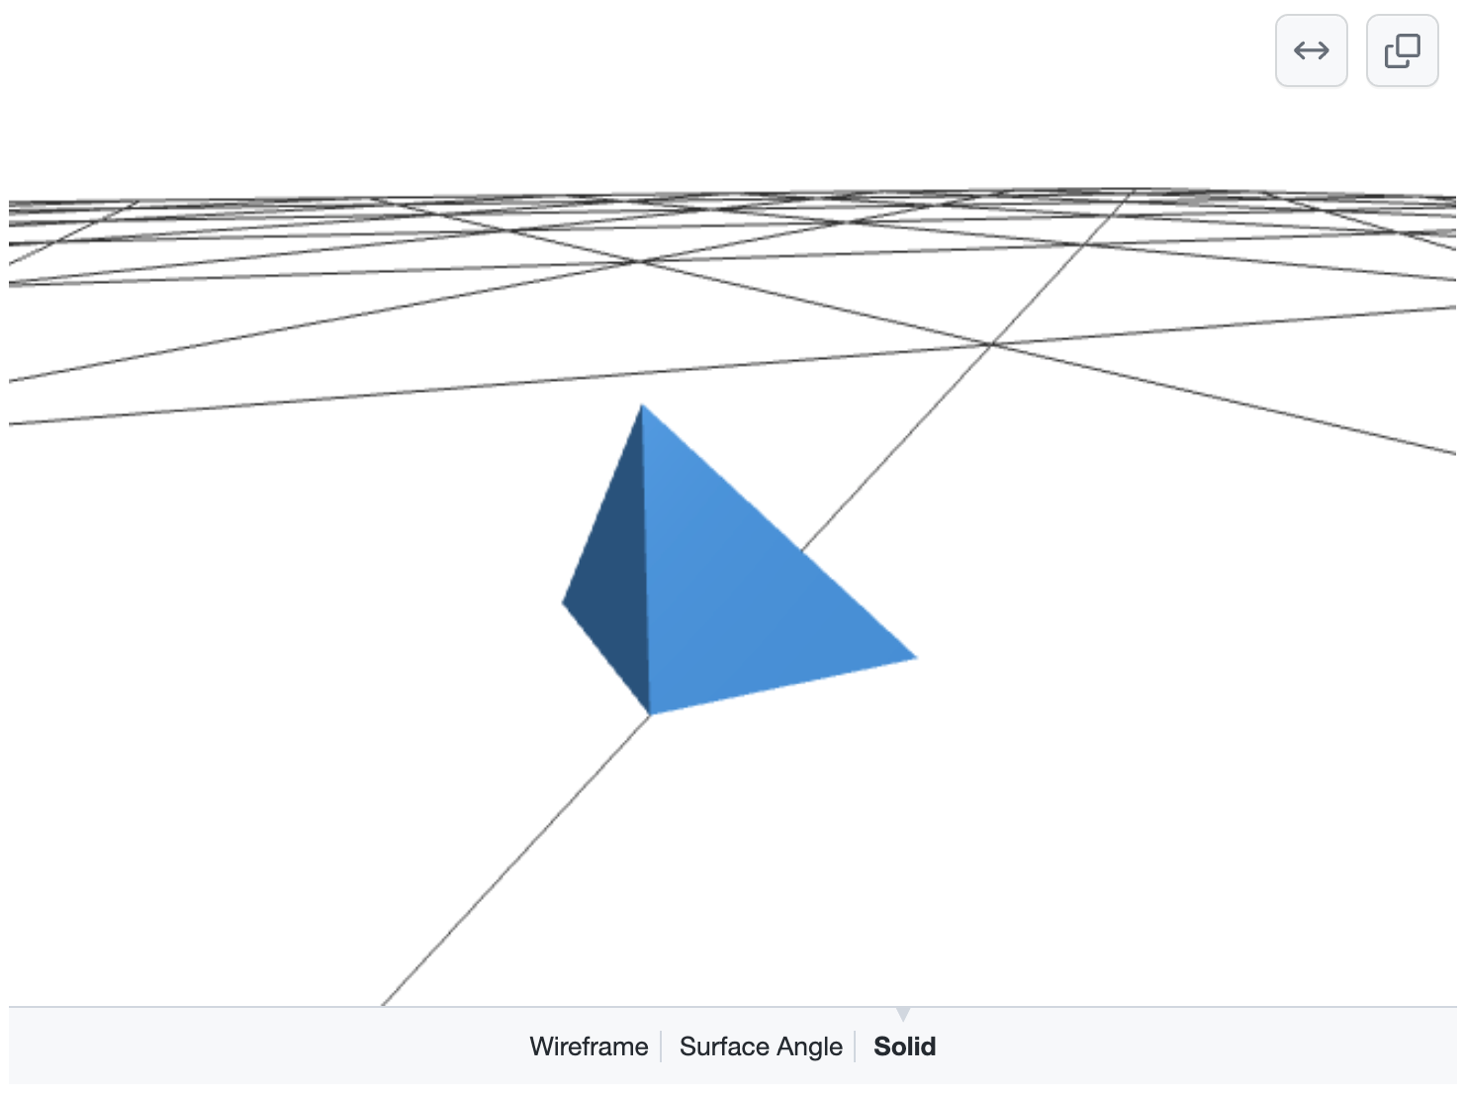
例如,您可以创建一个简单的 3D 模型。
```stl
solid cube_corner
  facet normal 0.0 -1.0 0.0
    outer loop
      vertex 0.0 0.0 0.0
      vertex 1.0 0.0 0.0
      vertex 0.0 0.0 1.0
    endloop
  endfacet
  facet normal 0.0 0.0 -1.0
    outer loop
      vertex 0.0 0.0 0.0
      vertex 0.0 1.0 0.0
      vertex 1.0 0.0 0.0
    endloop
  endfacet
  facet normal -1.0 0.0 0.0
    outer loop
      vertex 0.0 0.0 0.0
      vertex 0.0 0.0 1.0
      vertex 0.0 1.0 0.0
    endloop
  endfacet
  facet normal 0.577 0.577 0.577
    outer loop
      vertex 1.0 0.0 0.0
      vertex 0.0 1.0 0.0
      vertex 0.0 0.0 1.0
    endloop
  endfacet
endsolid
```

有关使用.stl文件的更多信息,请参见“使用非代码文件”。